Live detection
Scans tell you what a machine looks like when they run. Live detection watches it all the time: the agent loads small watchers into the Linux kernel that see every program that starts, every write to a few sensitive files, the network connections that matter, a process becoming root, kernel modules loaded and one process taking control of another, as it happens, and its rules raise an alert within seconds when something looks like an attack.
It's off until you turn it on, for each host or for all of them; scans, schedules and notifications work the same whether it's on or off. It needs the DeaconGuard agent 1.27.0 or later. A host with it off loads nothing into its kernel. The watchers, the code that loads them and the rules are all DeaconGuard's own; nothing else sits between the agent and the kernel.
Where it runs
The watchers run in the machine's kernel, which every container on the machine shares, so one agent sees the machine and all its containers. Nothing is installed in the containers.
| Where | Watched? | How |
|---|---|---|
| Linux servers: virtual machines, cloud instances, bare metal | Yes | The agent |
| Docker and Podman containers, Docker Compose services | Yes | The agent on their machine |
| Kubernetes nodes and their pods (EKS, GKE, AKS and others on ordinary nodes) | Yes | The node agent DaemonSet; the cluster agent alone can't, as it only talks to the Kubernetes API |
| Serverless containers: AWS Fargate, GKE Autopilot, Cloud Run, Azure Container Instances | No | No agent can run on their machines |
| Sandboxed containers: gVisor, Kata Containers, Firecracker | No | Each has a kernel of its own, which the machine's agent can't see into |
| Docker Desktop on a Mac or Windows | No | Its containers run in a hidden virtual machine without the agent |
| Macs and Windows machines | No | The watchers are Linux's |
| Linux older than 5.8 | No | The watchers need the kernel's ring buffer, new in 5.8; scans still run |
With a server installed with Docker Compose, its machine is watched when the Compose file's optional agent runs (docker compose --profile agent up -d). In an alert from a container, the alert names the program; naming the container and the pod is planned for a later release.
Turn it on
- One server: on the host's Runtime tab, Turn on live detection (admins). The tab says what it watches, what it costs, and whether the machine can run it. It starts within about 15 seconds, at the agent's next report.
- A Kubernetes cluster: on the cluster's page, the Live detection switch (admins). See Kubernetes.
- Every server and cluster: under Settings → Live detection, Turn on for all (admins). Turn off for all stops it everywhere.
- New servers: under Settings → Live detection, Turn on for new servers starts it on every server enrolled from then on. It's off unless you choose it. A new cluster's nodes follow their cluster's switch.
Turning it off unloads the watchers at the agent's next report. The audit log records each change.
Kubernetes
From 1.28.0, a cluster has one switch, on its page, and every node with a node agent follows it, nodes that join later included: turn it on once, and a node that joins next week is watched within a minute of the cluster agent's next scan seeing it. A node's own Runtime tab shows its state and its alerts, and says it follows its cluster; it has no switch of its own. Exclude this node, on a node's page, turns it off for that node only, and leaves the node out of the cluster's scans.
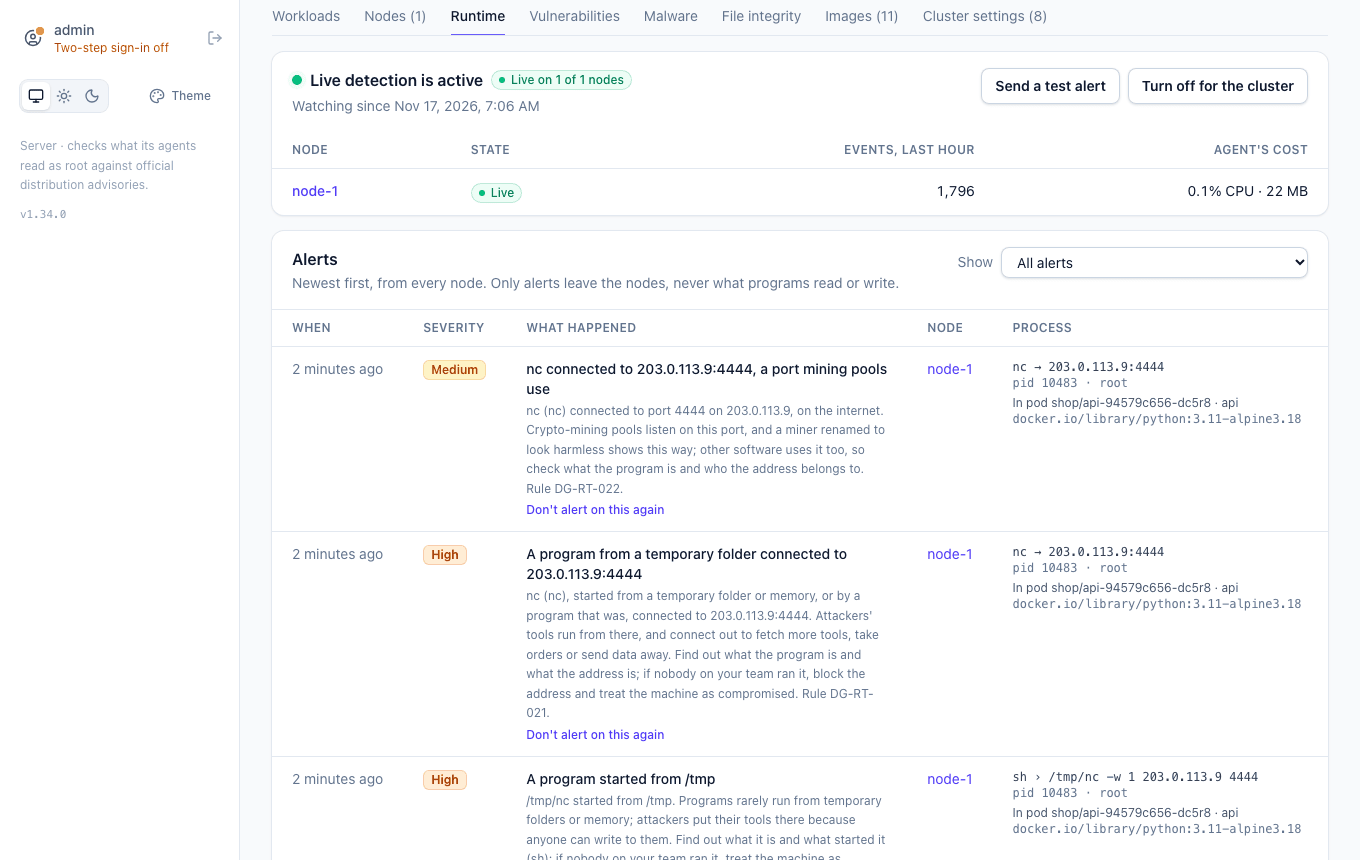
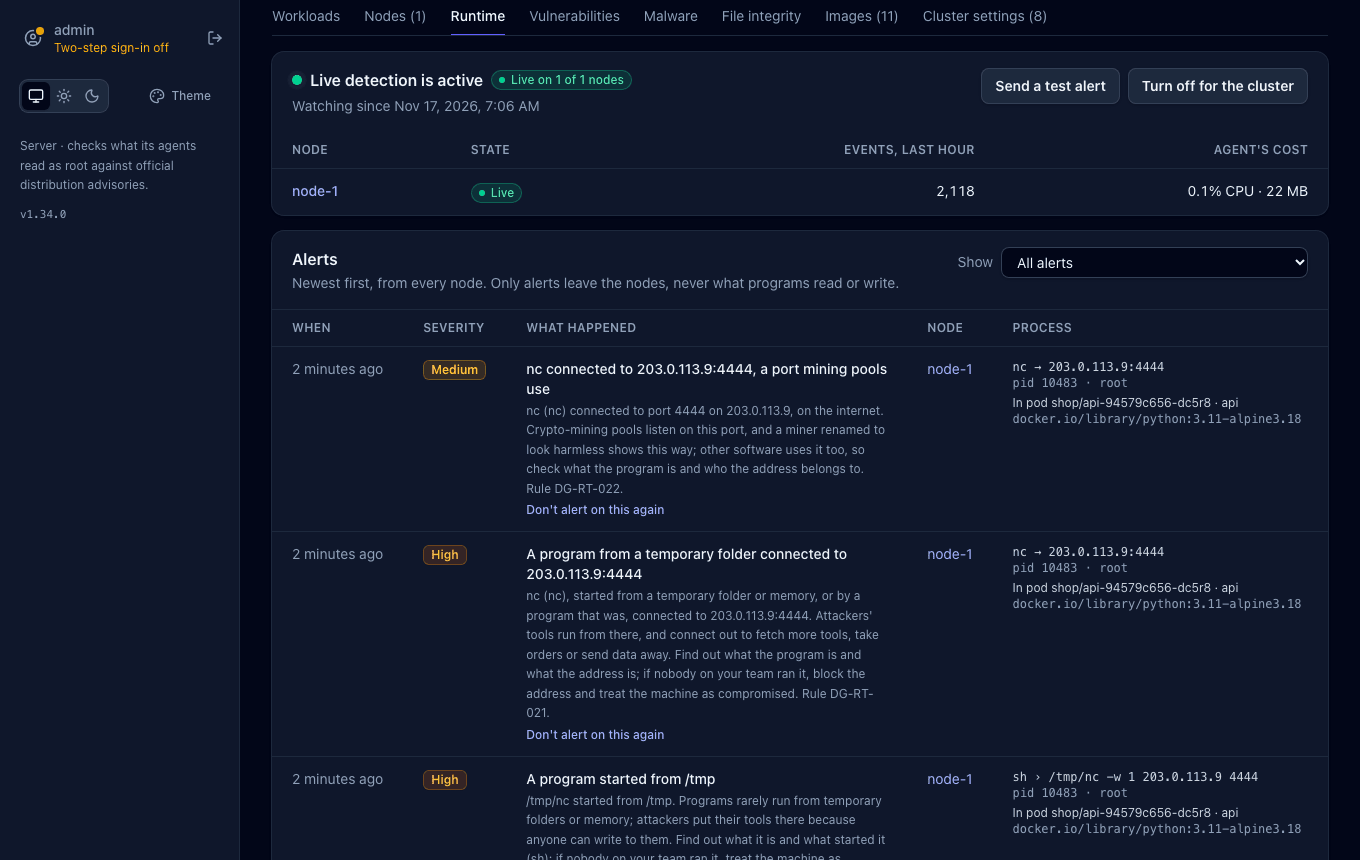
The cluster's Runtime tab shows every node's state, the events each looked at in the last hour and what it costs, and one stream of alerts from all the nodes, each naming its node. Send a test alert there asks every node where it's active for one.
Is it running?
Every agent reports every 15 seconds. On the dashboard:
- The Hosts list has a Live detection column, and a cluster shows how many of its nodes are watched, such as Live on 2 of 2 nodes.
- The Dashboard has a Live detection card: how many servers and clusters are watched, a cluster counted once with its nodes, how many could be but have it off, and which stopped.
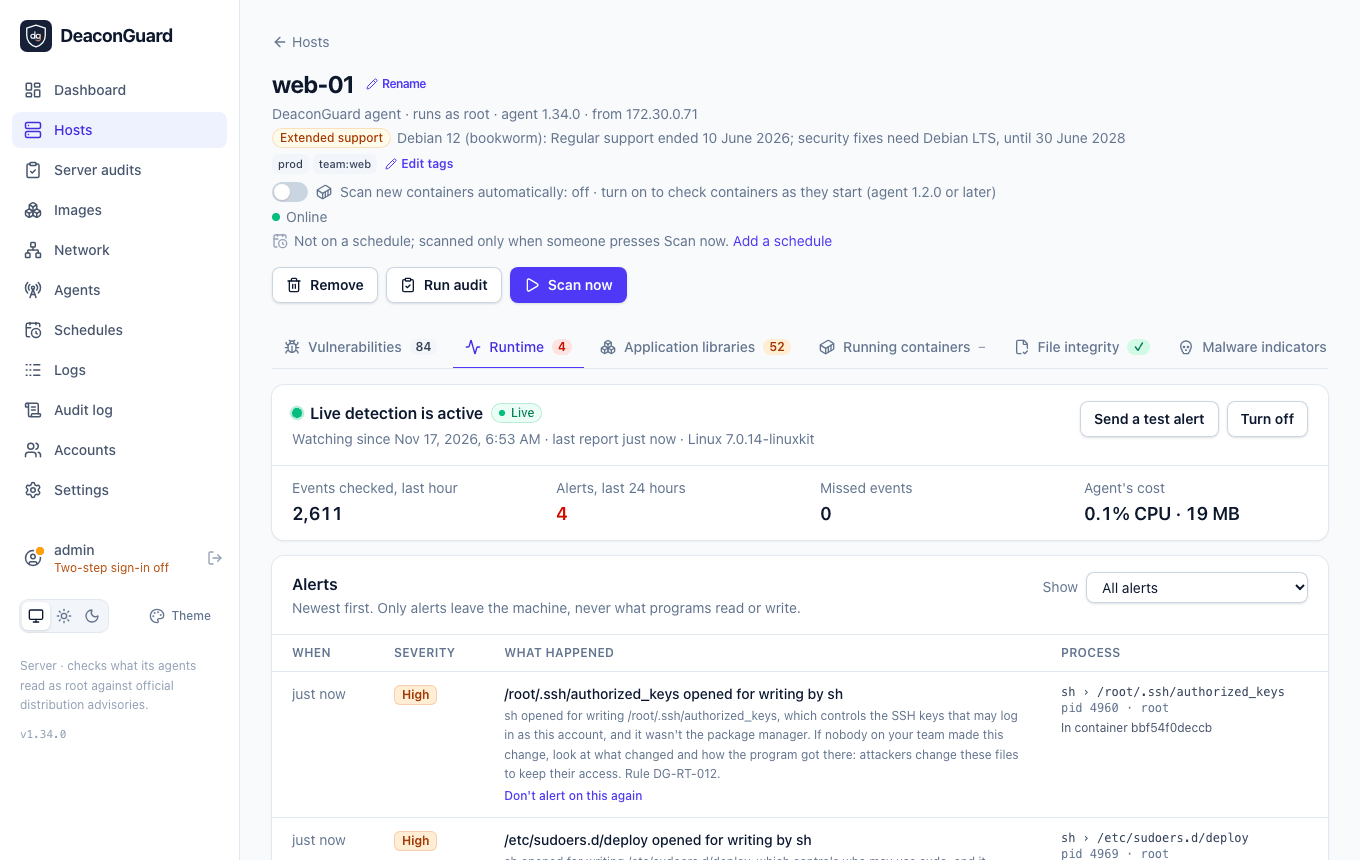
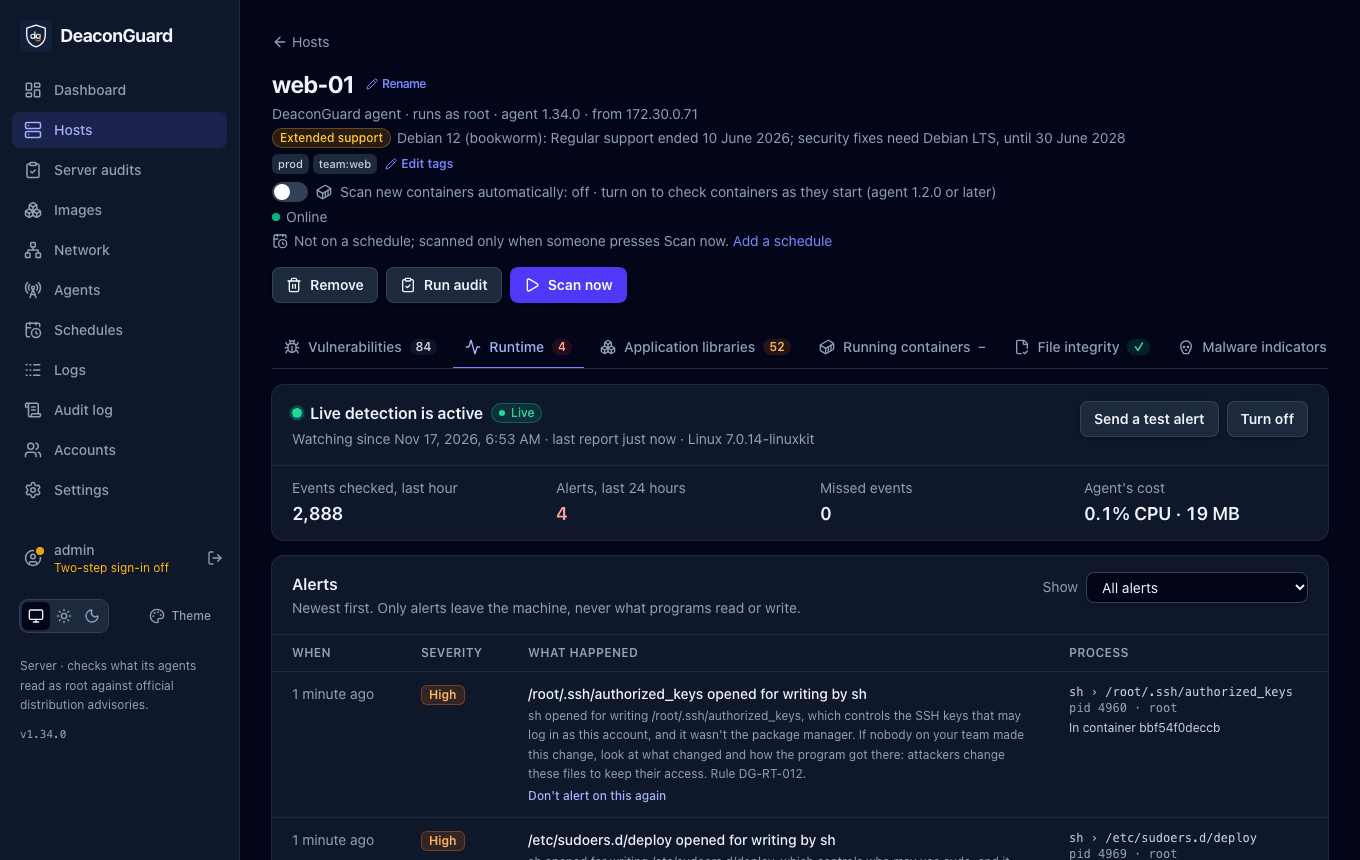
- Each host has a Runtime tab with its state, since when, the agent's last report, and four numbers: the events the watchers looked at in the last hour (proof that it's watching), the last day's alerts, missed events, and the agent's CPU and memory.
| State | Meaning | What to do |
|---|---|---|
| Live | Watching | Nothing |
| Stopped | It was running and stopped, with the reason: the agent stopped reporting, or the kernel refused something | Look at the reason and the agent's log on the host's page; the agent restarts it after a minute |
| Off | Not turned on for this host: the default | Turn on live detection on the Runtime tab, or for all hosts in Settings; for a node, the switch on its cluster's page |
| Not supported | The machine can't run it, with the reason: an old kernel, a Mac, or an agent without the rights to load the watchers | See Where it runs. The agent tries again every 5 minutes, so a fix such as mounting tracefs takes effect without restarting it (from 1.29.0; every hour before) |
| Agent too old | The agent is older than 1.27.0 | Upgrade the agent |
| Starting | Waiting for the agent's first report | Wait 15 seconds |
Missed events counts events the kernel dropped because the agent fell behind, and alerts left out over the limit of 30 a minute. It stays at 0 on all but very busy machines.
Send a test alert, on the Runtime tab (operators and admins), proves the whole chain: the agent starts a harmless program (a copy of true) from a temporary folder, the watchers see it start, the rule for programs in temporary folders matches it, and a Test alert arrives on the tab within about 20 seconds, and on the notification channels that tick Runtime alerts. Test alerts don't count as alerts. If the machine's temporary folders don't allow running programs, the tab says so.
To be told when it stops, tick Live detection stopped on a notification channel: it's sent when a host where it was running stops, including when its agent stops checking in.
What it detects
Programs that start
| Rule | Alert | Severity |
|---|---|---|
DG-RT-001 | A program starts from /tmp, /var/tmp or /dev/shm, or from memory without a file. Attackers put their tools there because anyone can write to them | High |
DG-RT-002 | A shell starts under a server that has no reason to run commands: nginx, Apache, lighttpd, Caddy, PHP-FPM, MySQL, MariaDB, Redis, MongoDB, Memcached or uWSGI. It's how a web shell, an injected command or an exploited service shows | Critical |
DG-RT-003 | A program with a crypto miner's name, or given a mining pool's address (stratum+tcp://), starts | Critical |
DG-RT-004 | A shell runs a command that downloads a script and pipes it into a shell, such as curl … | sh, with no person at a terminal: from a scheduled job, a service or a script | High |
Programs that go test and go run build in /tmp/go-build… aren't reported for DG-RT-001 when the go tool starts them, as it does on every build machine. PostgreSQL isn't on the list for DG-RT-002, since its archive_command runs a shell by design. Typing curl … | sh yourself, at a terminal, isn't reported.
Sensitive files that change
| Rule | Files | Severity |
|---|---|---|
DG-RT-010 | Accounts and passwords: /etc/passwd, /etc/shadow, /etc/group, /etc/gshadow | High |
DG-RT-011 | Who may use sudo: /etc/sudoers and /etc/sudoers.d/ | High |
DG-RT-012 | SSH logins: every account's authorized_keys, and /etc/ssh/sshd_config with sshd_config.d/ | High |
DG-RT-013 | What runs on its own: /etc/crontab, /etc/cron.*, /var/spool/cron/, systemd unit folders, /etc/rc.local, and /etc/ld.so.preload, a library loaded into every program | High; Critical for ld.so.preload |
A file is reported when a program opens it for writing, renames another file onto it, or links it. The watchers see the attempt, before the kernel checks the program's rights, so an attempt that fails is reported too: someone trying to write to sudoers is worth knowing about either way. Changes made by the package manager (apt, dpkg, dnf, yum, rpm, zypper, apk, automatic updates) aren't reported. Changes made with the usual admin tools (useradd, passwd, visudo, crontab, systemctl and others) are, as Medium: most likely someone on your team, worth knowing.
A file written by a relative path, such as passwd from inside /etc, is reported when its name is one of those above; the agent reads the program's folder to place it, or names the file where it usually lives when the program has already exited.
Network connections
From 1.30.0, with agents 1.30.0 and later.
| Rule | Alert | Severity |
|---|---|---|
DG-RT-020 | A reverse shell: a shell whose input and output are a network connection, so whoever is at the other end types its commands. Caught when a shell is started with a connection as its input and output (as nc -e and socat do), under a program that holds one (as a script's pty.spawn does), or when a shell connects out with /dev/tcp and takes the connection over | Critical |
DG-RT-021 | A program started from /tmp, /var/tmp, /dev/shm or memory, or a process such a program started, connects out. Attackers' tools connect out to fetch more tools, take orders or send data away | High |
DG-RT-022 | A connection to a port crypto-mining pools listen on (such as 3333, 4444, 5555, 7777, 14444 or 45700) on the internet. Catches a miner renamed to look harmless, or given its pool in a file. Other software uses some of these ports too, so it's medium | Medium |
The watchers look at every IPv4 and IPv6 connection a program starts, and drop in the kernel all but those of shells, of programs marked as started from a temporary folder (and the processes they start, marked in turn), and to the pool ports. Local sockets, which most connections on a server are, are dropped first. Name lookups (port 53) and connections within the machine aren't reported for DG-RT-021 and DG-RT-022, nor are pool ports on private networks; programs that go test builds in /tmp/go-build… aren't reported. A shell checking that a port is open, as wait-for-it scripts do, isn't a reverse shell: its input and output stay its own. A reverse shell is one alert however many of its processes hold the connection.
Alerts name the address and port the connection went to; the Runtime tab shows it after the program.
Privilege, kernel modules and other processes
From 1.32.0, with agents 1.32.0 and later.
| Rule | Alert | Severity |
|---|---|---|
DG-RT-030 | A process that isn't root becomes root, and its program isn't one the system allows to: the setuid programs such as sudo, su and passwd, or programs given the capability with setcap, owned by root in the system's folders. A process that becomes root any other way has usually exploited a flaw in the kernel or a program | High; Critical when the program, or one that started it, ran from a temporary folder or memory |
DG-RT-031 | A kernel module is loaded, or a load is tried, other than the system's own drivers loaded by modprobe or udev from /lib/modules. A module runs with the kernel's full power, which is how rootkits hide | High; Medium for a system module loaded by another program; Critical from a temporary folder or memory |
DG-RT-032 | A process takes control of another with ptrace (attach or seize), as debuggers do and as attackers do to read passwords and keys out of sshd, sudo or an SSH agent | High; Medium for a debugger run without a terminal; Critical from a temporary folder or memory |
DG-RT-033 | A process writes into another process's memory with process_vm_writev, which injects code that then runs under the other program's name | High; Medium for a debugger; Critical from a temporary folder or memory |
A privilege change is reported only when it worked, and root on the machine: root inside a user namespace, as rootless containers and browser sandboxes use, isn't. Debuggers (gdb, strace, ltrace, lldb, perf, dlv, rr, py-spy and others) used by a person at a terminal aren't reported, unless they attach to a process that holds credentials (sshd, sudo, su, login, ssh-agent, gpg-agent and others). A module load the kernel refuses is reported too, saying why: someone trying to load a rootkit is worth knowing about. The alert names the module's file, its parameters, and for ptrace the process taken over; in a container, the agent finds that process by the container's own process numbers.
The watchers look only at the user ID calls (setuid, setreuid, setresuid) of processes that aren't root and ask for root, at module loads, at ptrace's attach requests and at process_vm_writev. Every one of them is rare, so they cost nothing measurable.
What it doesn't detect yet
Live detection starts with what most break-ins on servers do. A way to run on kernels older than 5.8 is planned next. Scans still cover what they always did, such as host changes, malware on disk and attack paths.
An attacker who is already root on a machine can stop the agent, as they can any tool on it. Then the host's live detection shows Stopped, and Live detection stopped and Agents offline notifications are sent.
Alerts
The same alert, by the same program for the same file in the same container, is sent once every 10 minutes; repeats in between are counted, and the next one says how many. At most 30 alerts a minute leave a machine. Alerts are kept 30 days, at most 5,000 per host.
Which container
From 1.33.0, with agents 1.33.0 and later, an alert from a process in a container names the container: its name and image, and in Kubernetes its namespace and pod, such as In pod shop/api-7d9f · api, with ghcr.io/acme/api:2.1 under it. The Runtime tab's Show menu lists every container its alerts came from, and Outside containers for the machine's own processes.
The kernel's watchers record the cgroup of every event, which names the container even after a short-lived program has exited and whatever process namespace the agent runs in. The agent then asks the container runtime about that container once, with docker inspect, podman inspect or crictl inspect (run on the node through its mounted root in Kubernetes), and remembers the answer for an hour. Docker, Podman, containerd and CRI-O are supported. When no runtime knows the container, the alert shows its short ID.
Allowlist
Some alerts are normal for a machine: a backup tool loading its kernel module, a monitoring agent using ptrace, build jobs running programs from /tmp. From 1.33.0, an admin can allow them, so they're skipped and only counted, and the alerts that matter stay visible:
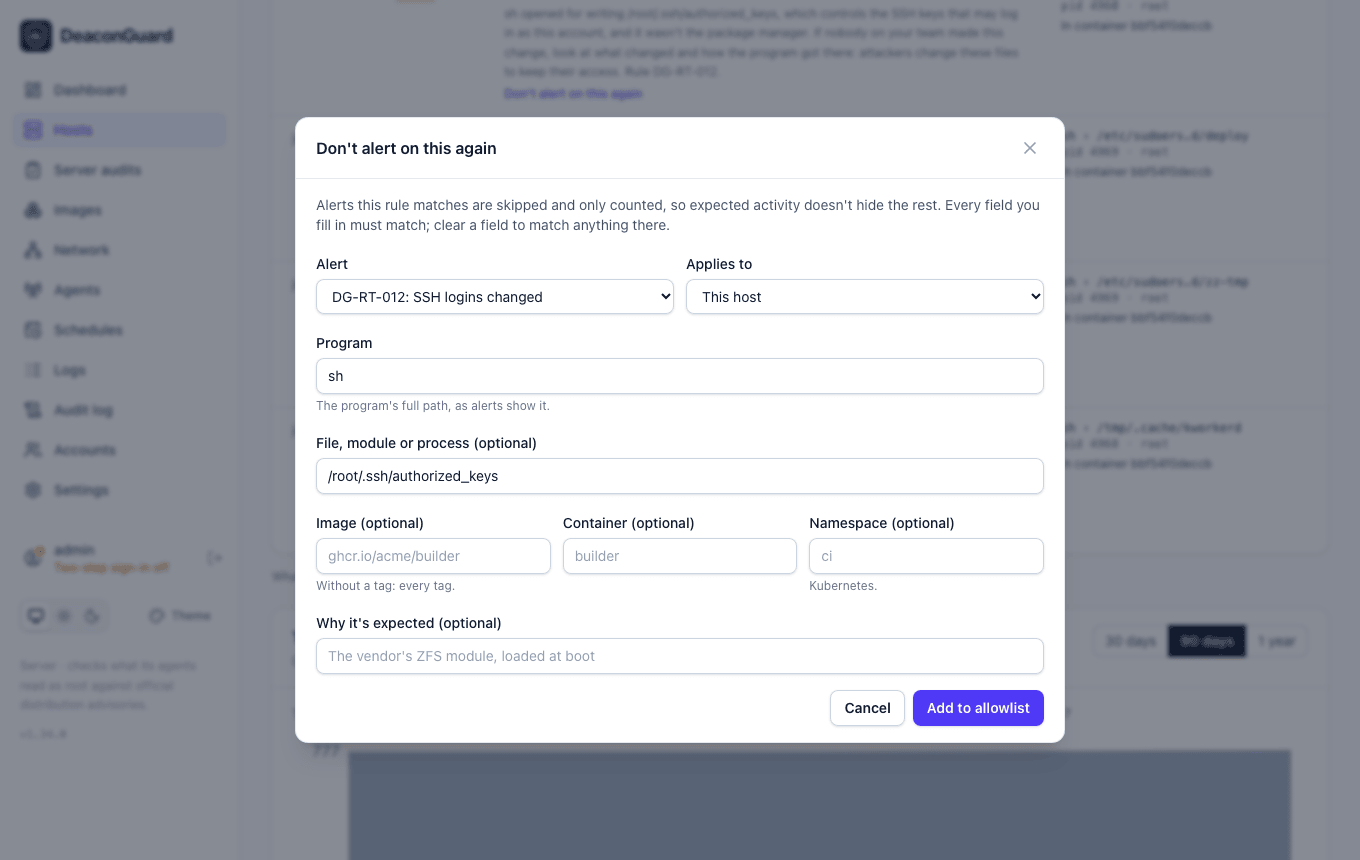
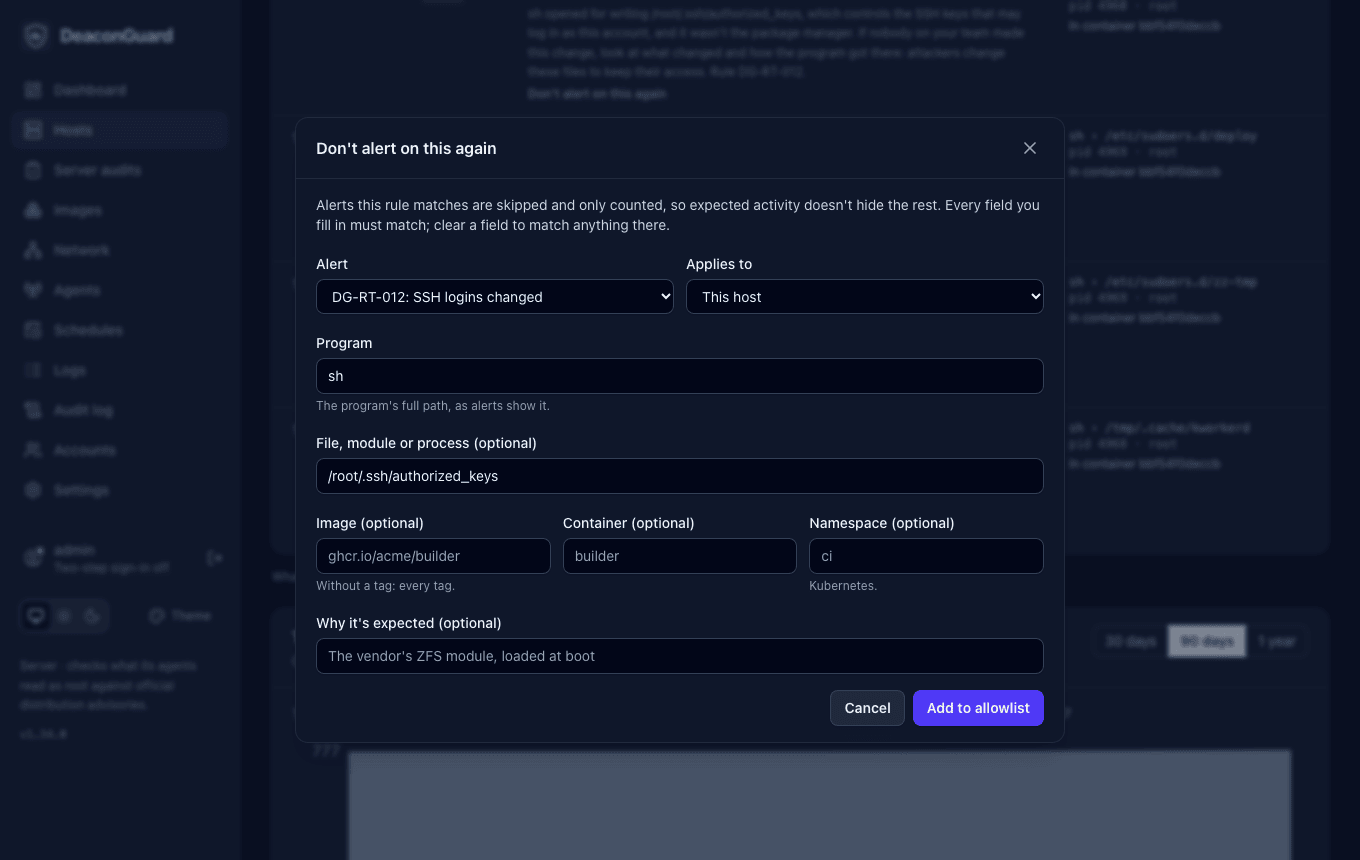
- Don't alert on this again, on an alert in the Runtime tab, opens a rule filled in from it: the alert's rule, its program, its file or process, and its container's image (without the tag, so every tag), container name and namespace. Clear a field to match anything there; every field left filled in must match.
- Applies to: the host, its cluster, or all hosts.
- Settings → Live detection allowlist lists every rule with what it matches, where it applies, who added it and why, and how many alerts it skipped, and when it last did; Edit and Remove are there too.
A rule always names one alert rule and at least one program, file, image, container or namespace, so no rule turns off a whole kind of alert. Test alerts are never skipped. Adding, changing and removing rules is recorded in the audit log, and the host's Runtime tab says how many rules apply and how many alerts they skipped.
Agents 1.33.0 and later get their rules with each report, every 15 seconds, and skip matching alerts before the 30-a-minute limit, so an expected alert can't crowd out others. The server skips them too, for older agents and for the seconds before an agent has a new rule; a rule you remove stops skipping within 15 seconds.
To be told about alerts, tick Runtime alerts on a notification channel: critical alerts are sent as critical, the others as warnings, a report's alerts together in one message.
What leaves the machine
Only alerts, and the status above. An alert holds the rule, the program and its command line (with anything that looks like a password or token masked), the program that started it, the account, the process ID, for a file its path, for a connection the address and port it went to, for a kernel module its file and parameters, for ptrace the program taken over, and for a process in a container the container's ID, name and image, and its namespace and pod. Each report's reply brings the host's allowlist rules back to the agent. The watchers' events, and what programs read or write, stay on the machine.
How light it is
- In the kernel, the watchers look at each program that starts and each file opened for writing. A write is compared with the watched paths eight bytes at a time and dropped there unless it's one of them, so the agent hears about every program start but only the few writes that matter. Files opened only for reading cost nothing.
- Connections add about 0.4 µs to each
connect()a program makes, measured on a test machine making 200,000 in a row; the connections that don't matter are dropped in the kernel and never reach the agent. - The agent reads the watchers' events from a ring buffer of 256 KB, the kernel's own one, and runs the rules on them. It only reads
/procfor an event a rule already suspects. - Measured on a test machine (Ubuntu 24.04, arm64): at rest, the agent used 20 ms of CPU a minute (0.03% of one CPU) and 22 MB of memory. Under a storm of 4,400 programs starting a second, with as many file writes, far busier than most servers, it used about 3% of one CPU and 26 MB, and the storm ran 2% slower than without it. The Runtime tab shows the agent's own numbers for each host.
The watchers use only the kernel's stable tracepoints, for system calls and for programs starting and ending, which is why one build runs on every kernel from 5.8 on. The kernel checks each watcher before running it, so a watcher can't crash or hang the machine.
What it needs
- Linux 5.8 or later, on
x86_64orarm64. - The agent running as root, as it does when installed with the install script or the packages. In Kubernetes and Docker Compose, the agent's container needs the
BPFandPERFMONcapabilities, which the Helm chart, the Kustomize base and the Compose file give it from 1.27.0. - The kernel's tracing file system at
/sys/kernel/tracing(or/sys/kernel/debug/tracing), which systemd mounts at boot. An agent installed on the machine mounts it when it isn't; an agent in a container can't, so on a Kubernetes node or a machine running the Compose agent without it, the host shows Not supported, saying so: mount it on the machine withmount -t tracefs tracefs /sys/kernel/tracing.