Kubernetes clusters
deaconguard kube scan checks a running cluster through the Kubernetes API, read-only: it lists objects and changes nothing. It needs DeaconGuard 1.5.0 or later.
deaconguard kube scan                          # the kubeconfig's current context
deaconguard kube scan --context prod --images --fail-on high
deaconguard kube scan --format sarif --output cluster.sarif
It checks:
- Workloads: Deployments, StatefulSets, DaemonSets, Jobs, CronJobs, and pods and ReplicaSets that no controller owns, with the same rules as manifests: privileged containers, host namespaces and folders, capabilities, running as root, secrets in environment variables, and the rest. A Deployment's pods are checked once, through it.
- RBAC: cluster-admin bindings, wildcard roles, roles that read secrets or escalate.
- Namespaces: with pods but no NetworkPolicy, or no enforced Pod Security Standard.
- The Kubernetes version: past its end of life, behind its latest patch, and Kubernetes' own vulnerabilities from OSV (only the version is sent). The release dates come from endoflife.date.
- The API server's settings, where it runs as a pod, as kubeadm sets it up: authorization, anonymous requests, audit logging, encryption of secrets, profiling. Managed and embedded control planes (EKS, GKE, AKS, k3s) don't show them, and the scan says so.
- Running images, with
--images: each image pods use is read from its registry, as image scans do, and reported when a newer build fixes vulnerabilities. At most 100 images; registry logins come fromDEACONGUARD_REGISTRY_USERNAMEand_PASSWORD.
Kubernetes' own objects (kube-system, kube-public, kube-node-lease, and the built-in and kubeadm roles) need privileges by design and are left out; --include-system checks them too. Findings are accepted, as for manifests, with the deaconguard.io/ignore annotation on the object, or --skip. --fail-on, --format and --output work as for pipelines.
In the dashboard
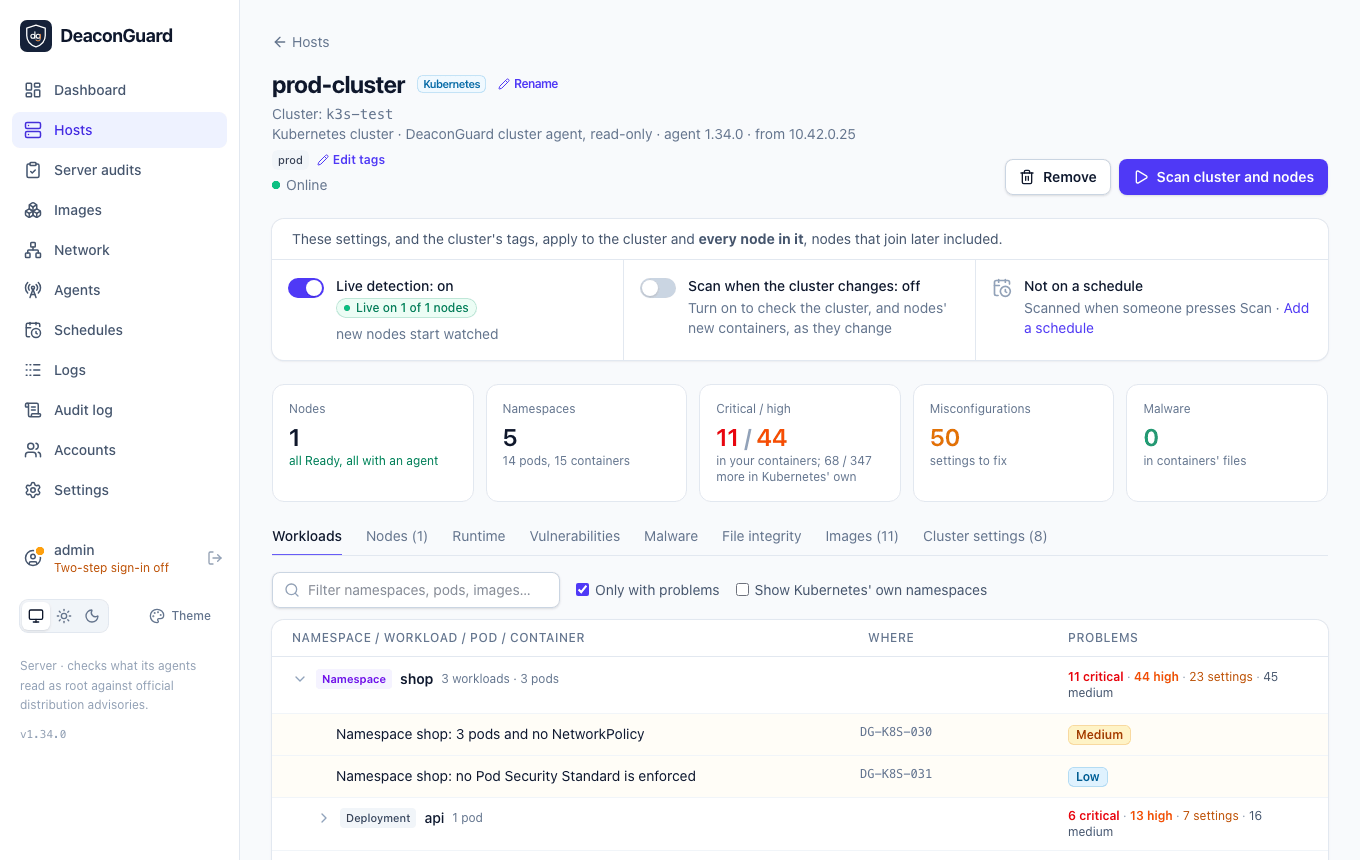
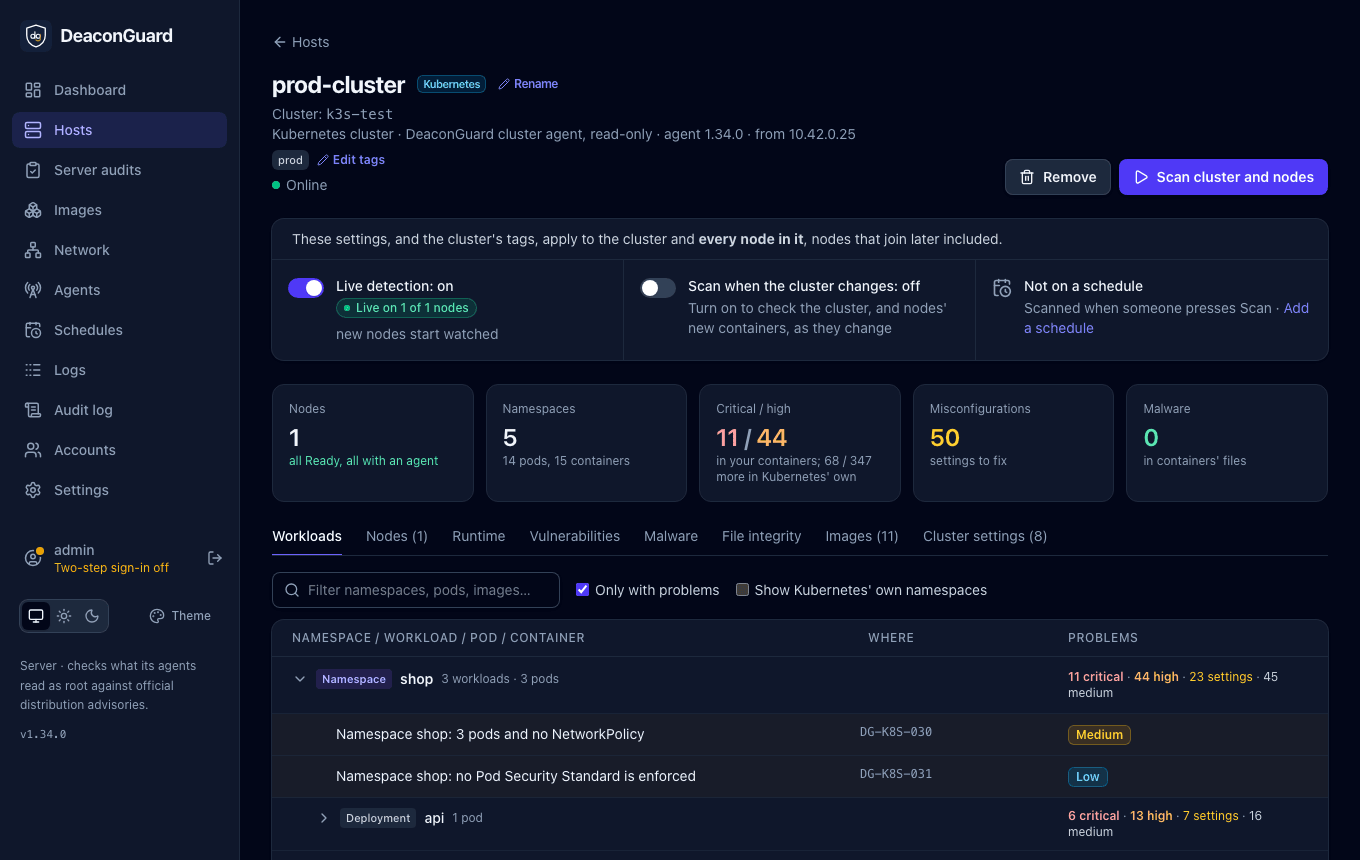
To check a cluster from the server, on a schedule and with notifications, install the cluster agent in it: cluster.enabled=true in the Helm chart. It enrolls with the same token as the chart's node agents, enrollment.existingSecret (create it with Enroll a machine > Kubernetes), and appears on Hosts as a Kubernetes cluster, with its own page.
The cluster is what you manage
From 1.28.0, you manage a cluster as one, not node by node. Its settings are set on the cluster's page, and every node with a node agent follows them, nodes that join later included:
- Live detection: one switch for the whole cluster. See Live detection.
- Scan when the cluster changes: checks the cluster within a minute of a change, and the nodes' new containers as they start.
- Schedules: a schedule that scans the cluster scans its nodes too, with the checks that apply to each: the Kubernetes check on the cluster, the others on the nodes.
- Tags: the cluster's tags are its nodes' tags, for notifications and maintenance windows.
- Scan cluster and nodes: the cluster's scan runs the Kubernetes check on the cluster, and the checks you tick on each node.
A node's page says Follows CLUSTER's settings, and a node's own switches, tags and live detection can't be changed: the API answers 409 and names the cluster. The one thing set on a node is Exclude this node (admins): an excluded node is left out of the cluster's scans and schedules, and live detection is off on it; it keeps the cluster's tags, and you can still scan it with Scan this node.
A cluster is one entry on Hosts, Agents and the dashboard, marked Kubernetes, with its nodes summed in it: how many, whether they're online, whether any runs an older agent, live detection on how many, and its nodes' vulnerabilities, each counted once (Nodes, linking to them). Its nodes are listed on its page, not as hosts of their own. The server ties a node agent's host to its cluster by the node's name, from the cluster agent's scan; when two machines have the same name, the one enrolled with the cluster's token wins.
A node that leaves the cluster, as when a node pool scales down, stays on the cluster's page, marked as gone, and is removed 3 days later once its agent has been silent since; the audit log says so. A node the cluster no longer lists whose agent still checks in, such as a renamed machine, becomes a host of its own.
The cluster's page
The cluster's page shows its settings, then what it runs, from its latest scan:
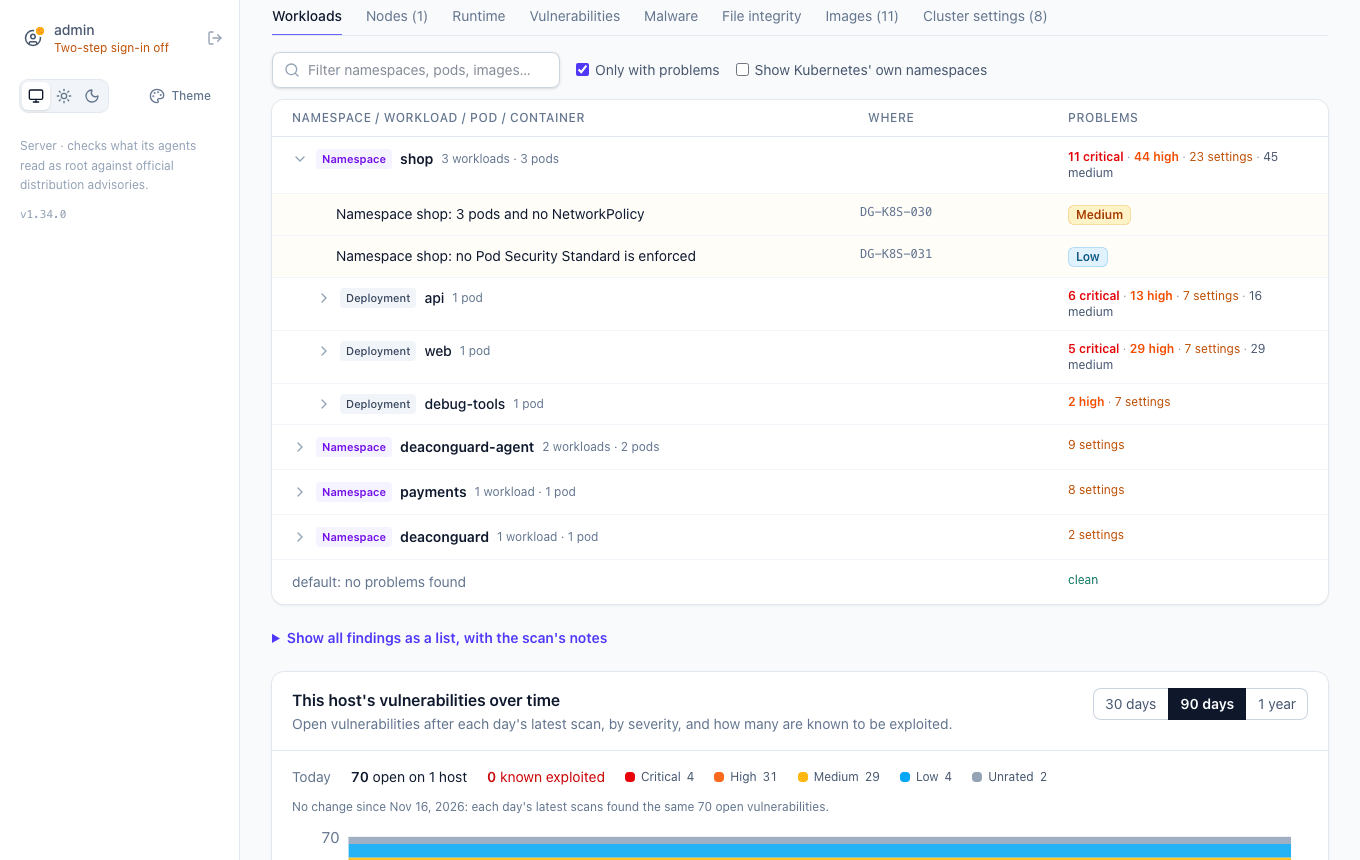
- Summary: its nodes (Ready, and with a node agent), namespaces, pods and containers, and the critical and high vulnerabilities, misconfigurations and malware found in them.
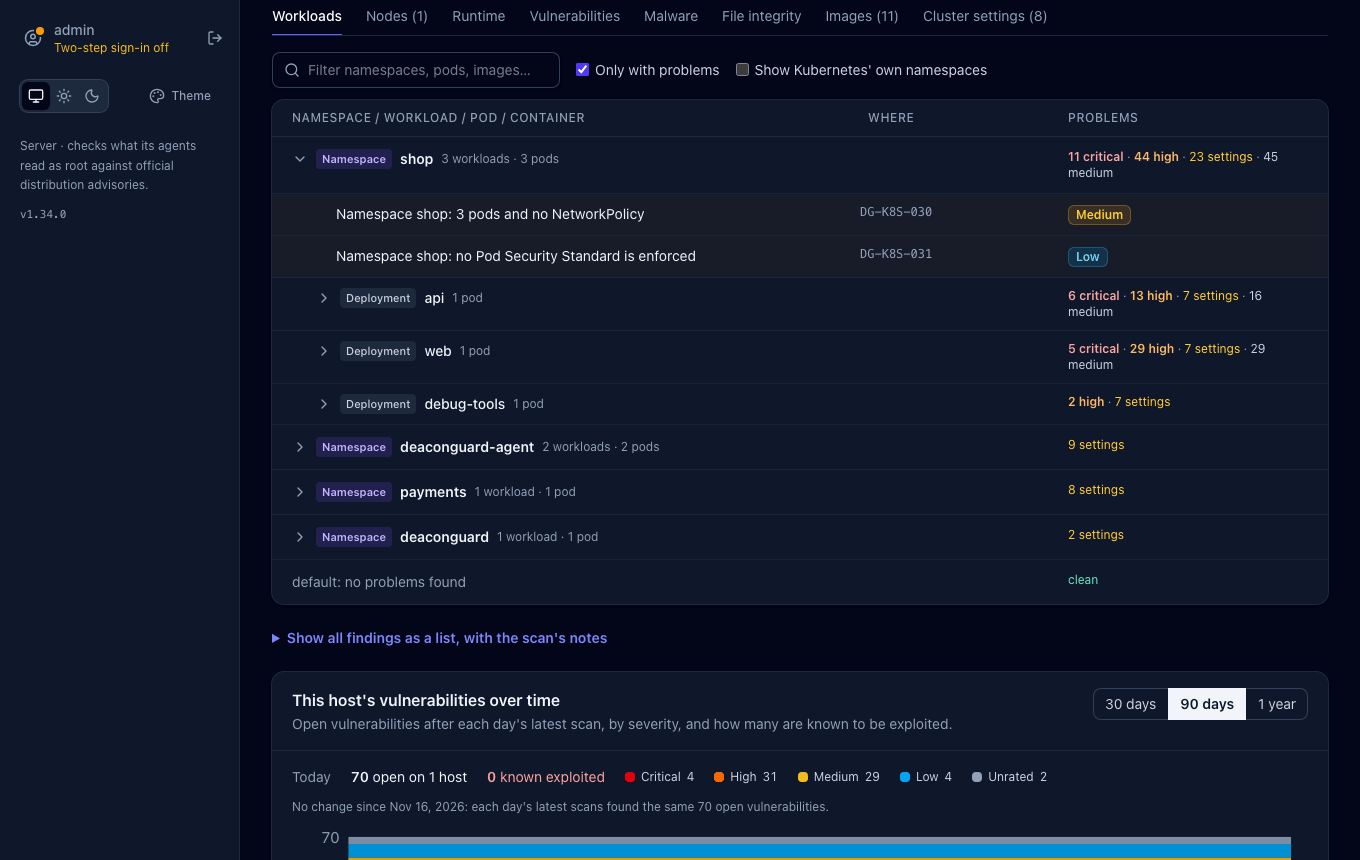
- Workloads: a tree of Namespace > workload (Deployment, StatefulSet, DaemonSet, CronJob, …) > Pod > Container. Each level adds up the problems of those under it: a container's vulnerabilities and malware, a workload's findings about its settings, a namespace's own (no NetworkPolicy, no Pod Security Standard). Each pod links to the node it runs on; each container shows its image, and whether its node agent checked that very container or the server checked its image. Only with problems is on at first, and Kubernetes' own namespaces are hidden until you show them; the filter finds a namespace, workload, pod, node or image by name.
- Nodes: each node's status, roles, address, OS, kernel and container runtime, its node agent and its version, its live detection, and its own vulnerabilities and malware. A node on an older agent than the others is marked, with how to upgrade. A node without a node agent says so: its packages aren't checked, and its containers only through their images. Each node opens its own page.
- Runtime: live detection on all the nodes: each node's state, events looked at and cost, and one stream of alerts from every node, each naming its node.
- Vulnerabilities, Malware and File integrity: the nodes' own findings from their latest scans, each once, with how many of the nodes it's on, such as all 3 nodes or 1 of 3 nodes; open it for the nodes and, for a package, each node's version. Nodes made from one image mostly share their findings, so a vulnerable package on three nodes is one row, and one thing to fix. Malware has the malware and antivirus checks' findings. Each tab says on how many nodes the check has run. Containers' vulnerabilities stay on Workloads and Images.
From 1.29.0, the dashboard, its trends and fix deadlines count a cluster's nodes' vulnerabilities once too: the same package and vulnerability on several nodes is one finding of the cluster, and the cluster is one host. A node's own page and trend still show its own.
- Images: every image the pods run, with the namespaces and pods that run it and its vulnerabilities.
- Cluster settings: findings about the cluster as a whole, such as roles that give cluster-admin, the API server's settings, and the Kubernetes version.
A container's vulnerabilities come from its node agent's latest Running containers scan, matched by the container's ID, which Kubernetes and the node's runtime report alike; malware in the files a container wrote comes from the node agent's latest Malware or Antivirus scan the same way. A container its node agent hasn't checked shows its image's vulnerabilities, from Running images. Node agents before 1.21.0 name the container malware was found in but not its ID, so their findings are matched by name, when only one container on the node has it.
The cluster agent lists the cluster's nodes, namespaces and pods from 1.21.0: upgrade it to see the tree; until then the page shows the findings only. It lists up to 5000 pods, so a large cluster's scan stays small; the page says how many more there are.
The cluster agent checks what the API shows: the objects' settings, not what runs inside the containers. Vulnerable packages and libraries in your pods are found by the node agent's Running containers check, which reads each container's files on its node; see Who checks what in your pods. The server also checks the images the pods run; see Running images.
A cluster runs one check, Kubernetes: Scan cluster and nodes runs it on the cluster and the checks you tick on its nodes, and a schedule with the Kubernetes check ticked runs it on every cluster it covers (and its other checks on machines). The cluster agent reads the cluster with the pod's read-only service account and sends what it found to the server, which adds the version's support and Kubernetes' own vulnerabilities, so the agent needs to reach only the API and the server. New critical and high findings, such as a privileged workload deployed since the last scan, are notified as New cluster findings; a failed scan as for any host.
Running images
From 1.20.0, each dashboard scan of a cluster also checks the images its pods run: their OS packages and libraries. From 1.20.1, it takes each build from where it is already known, and downloads only what isn't:
- From the node agents, without downloading anything. A build a node agent's Running containers scan read from a running container in the last day is taken from that scan: the same build, matched by its digest, read from the node's own copy. With the node agent on every node and the Running containers check on a schedule, nothing is downloaded.
- From its registry, for the others, as image scans do: read as data, never pulled or run. This covers clusters without the node agent, such as EKS on Fargate or GKE Autopilot. To never read from registries, set
server.clusterImageRegistry: falsein the Helm chart (DEACONGUARD_CLUSTER_IMAGE_REGISTRY=offelsewhere); images no node agent read are then left unchecked, and the scan says how many.
The scan's notes say how many images came from each.
- The build the pods run: the cluster agent sends each pod's image with the digest its runtime reports, so the server checks that exact build, not whatever the tag points to now. Cluster agents before 1.20.0 send the tags only; the server checks each tag's current build, and the scan says so.
- Findings: each image with vulnerabilities to fix, or known to be exploited, is one finding: how many, the most urgent, and the namespaces and pods that run it. Critical and high ones are notified as New cluster findings. The title stays the same while the counts change, so a rebuild with the same kind of problems isn't news; an image newly known to be exploited is. Add the image on the Images page to see each vulnerability.
- Private registries: the server uses the registry logins saved on the Images page. An image it can't read is listed in the scan's notes.
- Light: each build is read once and its result kept for a day, so later scans, and Scan when the cluster changes, only read images they haven't seen; a scan of a cluster whose images are all known takes about a second. A scan reads at most 10 new images, one at a time, within 10 minutes, and at most 100 in all; the next scans read the rest. A failure is retried after an hour. The results are kept in the server's memory, so after a restart the images are read again once.
- The server reaches the registries itself, as for image scans: Docker Hub, GHCR, your private registries; only for builds no node agent read, and not at all with
server.clusterImageRegistry: false.
Scan when the cluster changes
On the cluster's page, Scan when the cluster changes has the cluster checked within about a minute of a change: the cluster agent watches workloads, roles, namespaces and network policies through the API (the watch permission, which the chart's role has), and counts only what a scan would see. A Deployment's rollout or a pod restarting isn't a change; a new spec, a new role binding or a pod no controller owns is. Changes within a minute of the last such scan wait for the next one, so a busy cluster is scanned at most once a minute.
Warnings as workloads are applied
With cluster.admission.enabled=true, the cluster agent is also a validating admission webhook in warn mode. Each workload and role created or changed is checked with the same rules, and the client shows what it found; the object is always allowed:
$ kubectl apply -f debug.yaml
Warning: DeaconGuard DG-K8S-001 critical: Deployment shop/debug-tools: container tools is privileged
Warning: DeaconGuard DG-K8S-002 high: Deployment shop/debug-tools: hostNetwork: true
deployment.apps/debug-tools created
cluster.admission.severity (medium by default) sets the least severity that warns, and the deaconguard.io/ignore annotation is honoured. Kubernetes' own namespaces and the release's are left out. The chart makes the webhook's certificate and keeps it across upgrades; if the agent's pod is down, requests go through (failurePolicy: Ignore), so the webhook never stands in the way of a deployment. The pod then listens on port 8443, for the API server only.
Logging in
From your machine, deaconguard kube scan uses your kubeconfig (KUBECONFIG, or ~/.kube/config), its current context or --context, with any of its logins: client certificates, tokens, or an exec plugin such as aws eks get-token, gke-gcloud-auth-plugin or kubelogin. Inside a cluster, without a kubeconfig, it uses the pod's service account.
It only needs to read. This ClusterRole is enough, and has no access to secrets:
apiVersion: rbac.authorization.k8s.io/v1
kind: ClusterRole
metadata:
  name: deaconguard-cluster-scan
rules:
  - apiGroups: [""]
    resources: [pods, namespaces, nodes]
    verbs: [get, list]
  - apiGroups: [apps]
    resources: [deployments, statefulsets, daemonsets, replicasets]
    verbs: [get, list]
  - apiGroups: [batch]
    resources: [jobs, cronjobs]
    verbs: [get, list]
  - apiGroups: [networking.k8s.io]
    resources: [networkpolicies]
    verbs: [get, list]
  - apiGroups: [rbac.authorization.k8s.io]
    resources: [roles, rolebindings, clusterroles, clusterrolebindings]
    verbs: [get, list]
What the account may not list is left out, and the scan says so.
In the cluster
To scan from inside the cluster, for example every night, bind the role above to a service account and run the DeaconGuard image as a CronJob:
apiVersion: batch/v1
kind: CronJob
metadata:
  name: deaconguard-cluster-scan
  namespace: deaconguard
spec:
  schedule: "0 3 * * *"
  jobTemplate:
    spec:
      backoffLimit: 0
      template:
        spec:
          serviceAccountName: deaconguard-cluster-scan
          restartPolicy: Never
          securityContext:
            runAsNonRoot: true
            seccompProfile: {type: RuntimeDefault}
          containers:
            - name: scan
              image: ghcr.io/cloudopsshell/deaconguard:1.5.0
              args: [kube, scan, --format, json]
              env:
                - {name: DEACONGUARD_HOME, value: /tmp/deaconguard}
              securityContext:
                allowPrivilegeEscalation: false
                readOnlyRootFilesystem: true
                capabilities: {drop: [ALL]}
              volumeMounts: [{name: tmp, mountPath: /tmp}]
          volumes: [{name: tmp, emptyDir: {}}]
Rules for clusters
These rules need a live cluster; the manifest rules apply to its workloads and roles too.
DISA Kubernetes STIG: where a rule checks the same thing as a rule of the DISA Kubernetes STIG (V2R6, April 2026), its findings name the STIG rule, such as DISA Kubernetes STIG: V-242390, in their detail and in JSON and SARIF reports. Kubernetes' own vulnerabilities and an unsupported version map to V-242443. Many STIG rules check node files and flags DeaconGuard doesn't read through the API, so a clean scan is not a STIG assessment.
| Rule | Severity | Finding | Source | DISA STIG |
|---|---|---|---|---|
DG-K8S-030 | Medium | A namespace has no NetworkPolicy: its pods accept traffic from anywhere | NSA/CISA Hardening Guide | |
DG-K8S-031 | Low | A namespace doesn't enforce a Pod Security Standard | Pod Security Standards (baseline) | V-242437 |
DG-K8S-032 | High | The Kubernetes version gets no more security fixes | release support (kubernetes.io/releases) | V-242443 |
DG-K8S-033 | Low | The Kubernetes version is behind its latest patch release | release support (kubernetes.io/releases) | V-242443 |
DG-K8S-034 | Medium | Workloads run in the default namespace | DISA STIG | V-242383 |
DG-K8S-040 | Critical | The API server allows every request (AlwaysAllow) | NSA/CISA Hardening Guide | V-242382 |
DG-K8S-041 | Medium | The API server accepts anonymous requests | NSA/CISA Hardening Guide | V-242390 |
DG-K8S-042 | Medium | The API server keeps no audit log | NSA/CISA Hardening Guide | V-242402, V-242461 |
DG-K8S-043 | Medium | Secrets aren't encrypted at rest | NSA/CISA Hardening Guide | V-274882 |
DG-K8S-044 | Low | The API server's profiling endpoint is on | NSA/CISA Hardening Guide | |
DG-K8S-045 | Medium | The Kubernetes dashboard is installed | DISA STIG | V-242395 |
DG-K8S-050 | High | A running image has vulnerabilities a newer build fixes | NSA/CISA Hardening Guide |